Box Plot Math – Online IGCSE Tuition Malaysia
One of the favorite IGCSE questions is the Box Plot. You very often see this question when you are doing Extended or Core paper. Lets reveal some of the key concepts about this statistical topics involving box plot.
What is Box Plot?
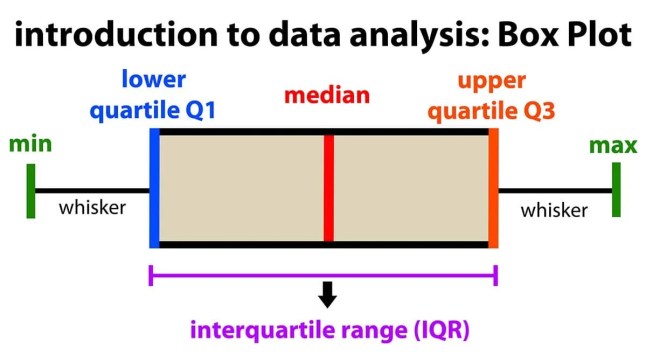
A box and whisker plot, also known as a box plot, is a graphical representation of a dataset that highlights its distribution and variability. It displays five key summary statistics:
- Minimum: The smallest value in the dataset.
- Lower Quartile (Q1): The median of the lower half of the data (25th percentile).
- Median (Q2): The middle value of the dataset (50th percentile).
- Upper Quartile (Q3): The median of the upper half of the data (75th percentile).
- Maximum: The largest value in the dataset.
Example of Box Plot Questions
Question:
The table below shows the marks obtained by a group of 15 students in a math test out of 50:
| Marks | 12 | 18 | 22 | 25 | 28 | 30 | 32 | 35 | 37 | 40 | 42 | 45 | 47 | 48 | 50 |
|---|
(a) Calculate the following:
- The minimum mark.
- The maximum mark.
- The lower quartile (Q1).
- The median
- The upper quartile (Q3Q
(b) Using your results from part (a), draw a box and whisker plot to represent the data.
(c) Comment on the spread of the data, including any symmetry or outliers.
Solution
- Minimum mark:
The smallest value in the dataset is 12. - Maximum mark:
The largest value in the dataset is 50. - Median
The median is the middle value of the ordered dataset. Since there are 15 data points (odd), the median is the 8th value:
12,18,22,25,28,30,32,35,37,40,42,45,47,48,50

Median=35
- Lower Quartile (Q1):
12,18,22,25,28,30,32,35,37,40,42,45,47,48,50


Q1=25 - Upper Quartile (Q3):
12,18,22,25,28,30,32,35,37,40,42,45,47,48,50


Q3=45


